Hurricane Sandy has become a dangerous storm with plenty of juice, as evident by the satellite imagery:
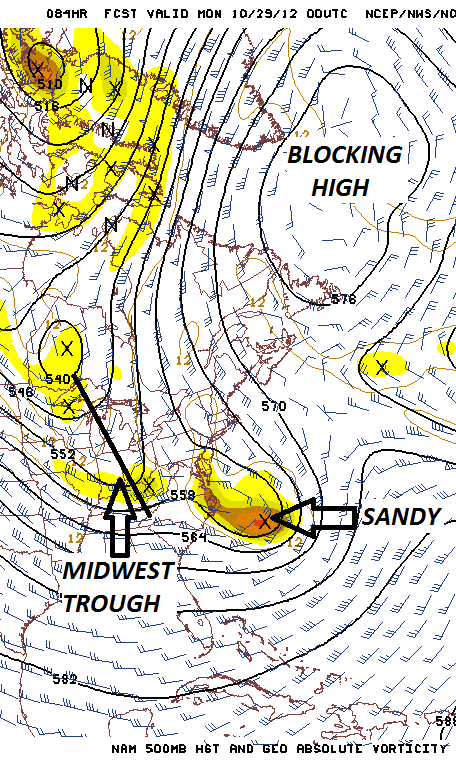
The short range models are starting to pick up the features that will drive Hurricane Sandy into the coast and NOT allow her to pass out to sea. Between the approaching Midwest trough and the Canadian Maritime blocking high, there is no room for “Sandy” to escape infamy. Here is what the NAM is showing by Sunday 8PM:
NAM simulated radar is showing a destructive storm underway for Long Island, New Jersey and down to the Virginia Capes Sunday evening, even though the circulation center of Hurricane Sandy is still well offshore:

The BIG question after this point: When will “Sandy” start her turn to the northwest? The longer range models still have plenty of variations, with landing points ranging from Long Island to Chesapeake Bay late Monday. Obviously, the further north that “Sandy” makes landfall within that window, the worse it will be for us.
Under the worst case scenario of a Long Island landfall, the Adirondacks would get multiple inches of rain with wind gusts over 40 mph on Monday. That could uproot a lot of trees and cause localized flooding. The worst damage BY FAR from Hurricane Sandy will be the middle-Atlantic / Northeast coastal region, which could be facing a billion-dollar disaster! Lingering rains would continue Tuesday and Wednesday.
As new data arrives through the weekend, we’ll get a more concrete idea of where Hurricane Sandy will make landfall.


